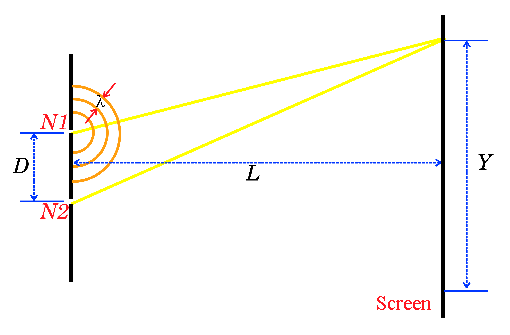
This experiment tries to visualize the pattern
of interference of the light of two coherent sources (they keep
a difference of phase constant in time). It gets the name from the scientific
Thomas
Young, who in 1801 used this interference pattern to prove
the wave nature of light.
The diagram of the experiment is shown in the figure.
On the left there is a screen with two narrow parallel slits separated
a distance D. The pattern of interference is observed on
the screen of the right. This screen is placed the parallel to the screen
of the two slits and very far from them in comparison with their separation
D.
The intensity of the light that one will see at the
different points of the screen depends on the difference of the paths travelled
by the light to arrive there. When this difference is a multiple
of the wavelength we will get a maximum, and when it is a multiple plus
half wavelength we will get a minimum.

| N: |
number of slits. (N = 2). |
| l: |
wavelength of the light, in nanometers. |
| D: |
distance between slits, in nanometers. |
| Y: |
central interval of the screen that we observe,
in centimeters. |
| L: |
distance between the slits and the screen, in meters.
(L >= 1) |
|
We can change these parameters with the window
of settings of the experiment when we do a simulation.

